Ten firms are 82% of a $94B market
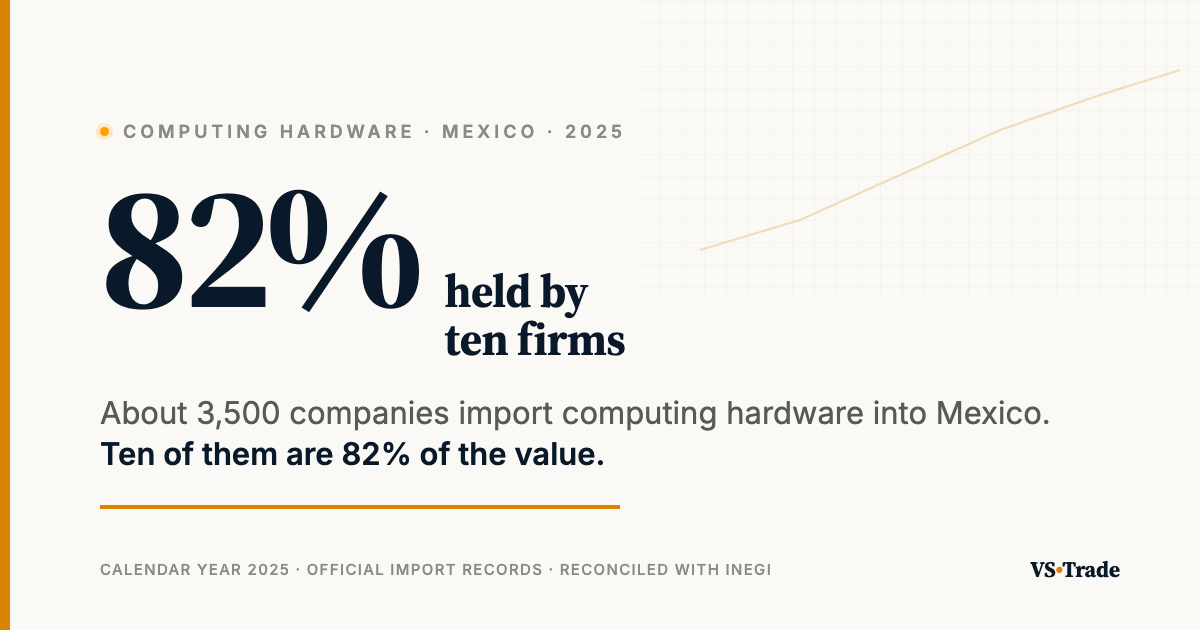
Roughly 3,500 companies imported computing hardware into Mexico during 2025. Ten of them account for 82% of the value. If you are trying to enter that market, 3,490 of those names are noise.
By VS-Trade Research · Structural analysis
The shape of a concentrated market
Computing hardware imports into Mexico reached $93.8B in calendar year 2025, up from $45.7B in 2024. Those are the headline numbers, and they are the least useful part of the picture.
The useful part is the distribution:
| Concentration (2025) | Share of value |
|---|---|
| Top 10 importers | 82.0% |
| Top 50 importers | ~96% |
| Remaining ~3,400 importers | under 4% |
Calendar year 2025, four computing tariff lines. Definitive plus temporary import universe, undepurated, deduplicated by week.
This is not a market with thousands of participants. It is a market with about a dozen participants and a long tail of companies buying incidental volumes.
Why this breaks the usual approach
The standard way to research a foreign market is to acquire a database of import records and analyse it. For a concentrated market, that approach inverts the effort: you pay for hundreds of thousands of rows, of which the ones that matter would fit on a single page.
Worse, raw volume creates false confidence. A list of 3,500 importers looks like a market with 3,500 opportunities. It is a market with roughly ten, and the other 3,490 names will absorb your commercial effort without returning anything.
The question worth answering is not "who imports this?". It is "who imports this at a scale that changes my quarter?" — and that is a much shorter list.
Concentration is itself the finding
There is a second reading, less obvious and more useful for planning.
A category where ten firms hold 82% behaves differently from a fragmented one. Prices are set by few actors. A single sourcing decision inside one of them moves the national figure. Entry is harder, but so is displacement once you are in — and a supplier who wins one of those accounts wins a disproportionate share of the category.
Fragmentation and concentration are not neutral descriptors. They tell you whether your commercial strategy should be volume-driven or account-driven, before you spend anything finding out empirically.
What we do with this
We do not sell the database. We sell the read: which firms constitute a category, how concentrated it is, how that concentration moved, and what the structure implies for someone trying to enter or defend a position.
Named entity detail is the deliverable of paid reports under NDA — never a public surface and never a self-service export.
The figures above cover calendar year 2025 and come from the definitive plus temporary import universe, excluding virtual transfers and rectifications. That universe reconciles with the merchandise trade balance published by INEGI for 2025 within 3.6%, a structural differential explained by the valuation basis and the treatment of virtual operations.
VS-Trade Intelligence compiles from legally obtained sources, including licensed third-party data providers, public records and proprietary analytical research. We do not redistribute raw datasets.
In one line
In a concentrated category, the value of trade data is not in how many rows you get. It is in how few you need.
Want the concentration profile of your category? How many firms constitute it, how concentrated it is and how that changed. Request a complimentary brief at vstrade.co.