Trade data ages badly, and faster than you think
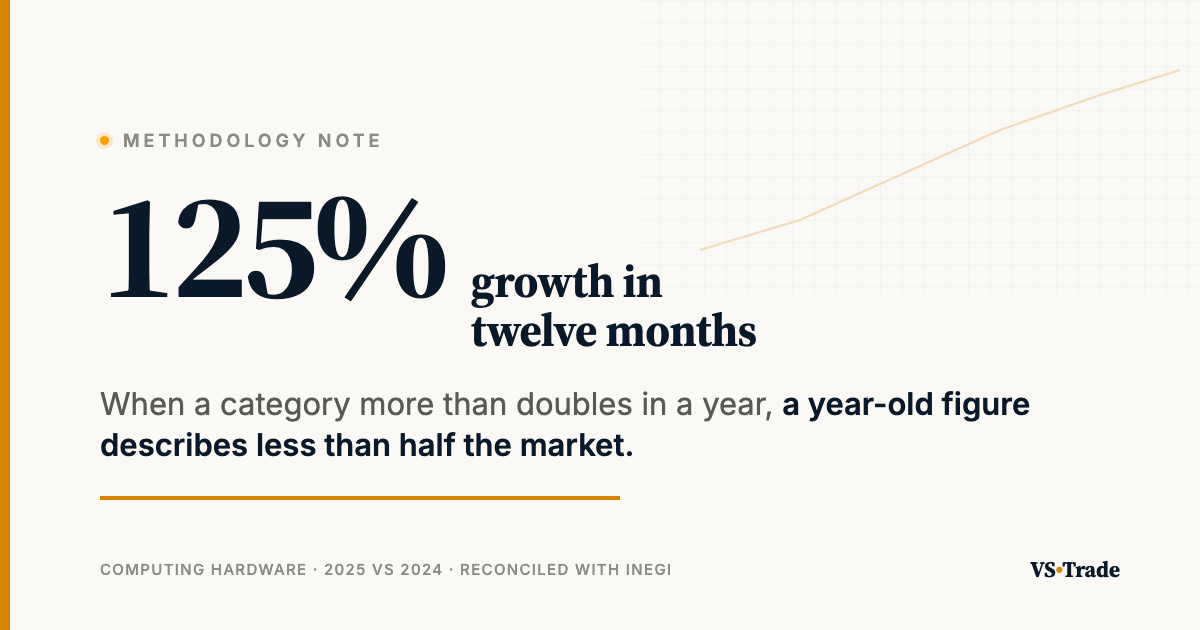
Most trade analysis is built on figures that are twelve to eighteen months old by the time anyone acts on them. In a stable category that is tolerable. In a category that grew 97% in a year, it means describing a market barely half the size of the one that exists.
By VS-Trade Research · Methodology note
The arithmetic of stale data
Computing hardware imports into Mexico reached $90.1B in calendar year 2025, against $45.7B in 2024. The category did not grow — it nearly doubled.
Now consider the normal research cycle. An annual dataset closes, gets processed, gets published, gets purchased, gets analysed, and informs a decision. Twelve to eighteen months pass between the last transaction in the file and the first action taken because of it.
Applied to this category, a decision made today on 2024 data is a decision about a market barely half the current size. Not slightly outdated. Wrong by nearly a factor of two.
Where staleness hurts most
Not every figure decays at the same rate, and it is worth knowing which of yours are perishable.
Volume levels decay fast in growing categories. The category above is the clear case.
Competitive position decays faster than volume. Market share moves before totals do. A supplier can lose two ranks in a category whose total barely changed — and that loss is invisible in an annual number.
Origin mix decays unevenly. It can be stable for years and then shift sharply when a tariff or regulation changes. Annual data smooths exactly the discontinuity you needed to see.
Structural ratios are the most durable. How much of a sector operates under a temporary regime, or how concentrated it is, tends to move slowly. Those you can trust for longer.
The practical implication: an annual report is adequate for structure and inadequate for position. If your question is "how does this market work", a yearly view is fine. If it is "where do I stand right now", it is not.
Why monthly changes the question
With a yearly cadence you can answer what happened. With a monthly one you can answer what is happening — and those support different decisions.
A quarter where a competitor gains three accounts is a fact you can respond to while it is still reversible. The same fact discovered fourteen months later is history. The data is identical; only the timing changed, and the timing is what determined whether it was actionable.
This is the reason our supplier-side work is built as a recurring monthly pulse rather than a one-off study. Not because a single report cannot be thorough, but because competitive position is a moving quantity and a snapshot of a moving quantity has a short shelf life.
The honest limitation
Fresher is not automatically better. Recent months carry more revision risk: records get corrected, rectifications land late, and a single unusual month can distort a short window badly.
That is why a month is read against its own trailing series rather than in isolation, and why an anomalous month gets flagged as anomalous instead of being reported as a trend. The same discipline applies to method: we have seen a year-over-year figure shift by double digits depending on whether the underlying records were deduplicated, with no change in the source data at all.
Speed without that discipline produces confident noise, which is worse than slow data.
The figures here cover calendar years 2024 and 2025 from the definitive plus temporary import universe, measured consistently across both years. That universe reconciles with the merchandise trade balance published by INEGI for 2025 within 3.6%, a structural differential explained by the valuation basis and the treatment of virtual operations.
VS-Trade Intelligence compiles from legally obtained sources, including licensed third-party data providers, public records and proprietary analytical research. We do not redistribute raw datasets.
In one line
Ask of any trade figure not only whether it is correct, but whether it is still true.
Want to know how fast your category is moving? Request a complimentary brief at vstrade.co.